
LEED Program: Models and Reality.
Assessing the Effectiveness of Water and Energy Consumption Reduction Measures in 11 New Buildings in the Pacific Northwest.
Cathy Turner New Buildings Institute Inc., Washington, USA*
Is it Real to Reduce Water and Energy Consumption in Buildings That Meet Modern Environmental Standards?
A recent study provides a preliminary assessment of the real-world performance of utility systems in 11 U.S. Green Building Council Leadership in Energy and Environmental Design (LEED)-certified buildings in the Pacific Northwest.
The study summarizes utility system performance data (baseline information about how the buildings perform overall) as well as data from initial modeling conducted when considering the buildings for LEED (see LEED Definitions).
The difference between the two levels of water and energy consumption corresponds to the savings originally expected from the implementation of planned measures to increase energy and water efficiency.
While a much more detailed analysis may be required to fully understand the performance of utility systems after commissioning, preliminary comparisons of results such as those conducted in this paper provide some useful insights and highlight the need for further analysis for the buildings in question.
BUILDINGS INVOLVED IN THE STUDY
A total of 31 buildings were considered eligible for the study. The final study included 11 buildings whose owners were willing and able to provide the information promptly.
The 11 buildings included in the final study range from Portland, Oregon, to Seattle, Washington, and range in size from office and library buildings to multi-family residential complexes. They range in size from 12,300 to 363,000 square feet (see table). All buildings had been in operation for at least one year at the start of the study.
Buildings Involved in the Study
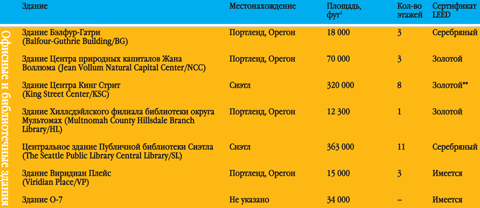

ENERGY CONSUMPTION RESULTS
Energy savings were assessed in two ways:
— Actual energy consumption figures were compared to a model baseline calculated when the buildings were submitted for LEED. This allowed us to estimate the effectiveness of energy reduction measures relative to relatively new buildings that had not undergone any energy efficiency measures. This method can reflect the climate, structure, and overall system characteristics of the buildings in question, but as explained in the Interpretation of Predictions footnote, the accuracy of the comparison is relatively limited when using models that were developed before the buildings in question were constructed.
— Actual specific energy use per square foot was compared to the average specific energy use per square foot for commercial buildings in the region. This was used to estimate energy savings across buildings of varying ages and types.
ENERGY SAVINGS WITH MODEL FORECASTING
All of the buildings had lower energy consumption per square foot than the baseline models predicted, with average savings of about 50%. The table (Figure 1) compares the actual energy consumption values of the study buildings with the baseline model predictions (no baseline model data were available for the King Street Center [KSC] building or the O-7 building). Eight of the 11 buildings had actual energy consumption values (ECS) that ranged from 45 to 55 kBtu per square foot per year. Two other buildings had significantly higher ECS values. These were:

— Building O-7, undergoing a multi-year renovation and replacement of its heating, ventilation, air conditioning and lighting control systems. It is no wonder that the energy costs for maintaining comfortable conditions here were so high. Further study may reveal how effective the recent changes have been;
— The Hillsdale branch of the Multomah County Library (HL) had the highest BTU value in the model (172 kBtu/sq ft/yr). However, the RUE was significantly lower than the model. The library was the only one-story building in the study and the smallest. It also had an unheated garage underneath. The library was open to the public seven days a week and had a significant number of personal computers in the building. Further research here is not part of the plan for this study.
The EER of each building was also compared with its design value. For all of them, the difference exceeded 20%. As can be seen from the table (Fig. 2), the EER was below the design value in six buildings, and above the design value in four others. This discrepancy can be explained by a number of differences between expected and actual conditions. If a building uses significantly more energy than was assumed by the initial design model, then further calibration can help to identify the exact nature and location of the problem. If a building uses less energy than was assumed by the model, then this will lead to an overestimation of the achieved energy savings. This is exactly the picture (see Fig. 2) that was typical for the HL and SL buildings, which were modeled with the highest energy savings.
SAVINGS COMPARISON
The Energy Star Target Finder was used to find the 50th and 90th percentile lines (Figure 3) in energy consumption. The TFR value was subtracted from the 50th percentile line. Nine of the 11 buildings had TFR values below this threshold. The average savings were about 25% of the average commercial building energy consumption.
Each method of calculating savings provides a different perspective on energy consumption. For example, a comparison with the original model data (see Figure 1) suggests that HL likely achieved at least the expected savings, while a comparison with average commercial building data (see Figure 3) suggests that building design features may result in greater energy consumption than other considerations would suggest.
Other comparisons may be more relevant to specific building owners. For example, if a newer building replaces an older building owned by the same owner, then a comparison of energy use between the two buildings may be most useful. For owners of industrial complexes with many buildings, a comparison of percentile distributions between the buildings may be most useful.
WATER CONSUMPTION RESULTS
This study also compared actual, baseline, and design values for indoor water use. However, this modeling was only performed for seven of the eleven buildings studied, as four of the buildings did not apply for LEED water efficiency certification.
The lack of adequate benchmark values in publicly available databases for commercial building water use made it impossible to perform an alternative assessment of the savings achieved.
In four of the seven buildings (Figure 4), actual water use was lower than the original baseline model value.

Variations in terms of the baseline water consumption reading were mainly due to differences in assumptions about the frequency and duration of use of faucets and toilets. Additional research aimed at studying water consumption may be useful in this industry, which will allow for a more accurate value to be determined and standards to be developed.
The example of the Jean Vollum Natural Capital Center (NCC) building illustrates a typical problem associated with efforts to improve water efficiency.
The upper boundary of the rectangle in the diagram (see Figure 4) corresponds to the total measured volume of water used in this building. However, water was also used for the needs of the restaurant and conference rooms, and for irrigation of the adjacent territory. Water consumption for these needs was not measured separately.
The top two segments of the rectangle are estimates of water consumption for irrigation (based on the difference between summer and winter water consumption values) and for restaurant needs (based on published average values for restaurants).
The remaining bottom segment of the rectangle corresponds to water consumption by the Center itself, and it is much closer to water consumption values in other office buildings.
CONSUMER SURVEY RESULTS
A survey of building users was also conducted on the comfort and functionality of temperature, air quality, lighting, noise and plumbing. Overall, positive ratings were received.
In all buildings, light levels and indoor air quality were found to be conducive to work. Complaints about noise and poor sound insulation noted in some buildings were a result of the use of shared office spaces with low partitions between workstations or desks without partitions between them. Interestingly, the survey conducted as part of this small study did not reveal a clear correlation, positive or negative, between the level of satisfaction with the temperature in the buildings and their specific energy consumption or the level of energy savings.
LESSONS AND CONCLUSIONS
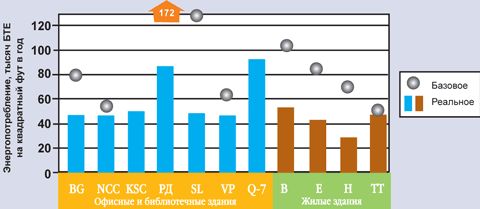
Figure 1. Actual specific energy consumption and its comparison with the baseline values obtained in the modeling
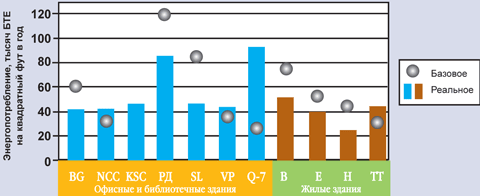
Fig. 2. Comparison of actual and design specific energy consumption
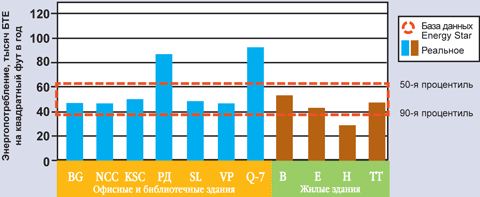
Fig. 3. Comparison of actual specific energy consumption with its average values
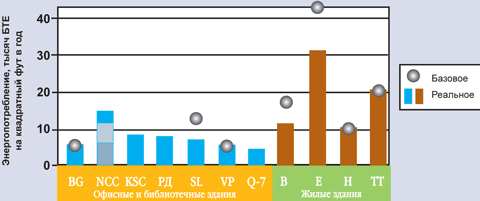
Fig. 4. Comparison of actual and baseline water consumption values
Simple steps taken during the design and construction of buildings can simplify subsequent measurement of actual energy savings and, possibly, contribute to their increase. It is necessary to include in building designs from the very beginning the possibilities for simplifying the organization of energy monitoring. However, it is advisable to consider the following factors:
— Even the simplest studies can be hampered by the lack of basic information on the use of utility systems. For example, the lack of individual measuring devices for different buildings on the same territory does not allow for further summing up of the operation of utility systems in these buildings.
— Key parameters for assessing utility system performance should be derived from initial models. For example, the reasons for expected utility system usage levels and the reasons for particularly high or low design specific energy consumption values. This information should then be provided to building owners and managers so that it can be used from the outset of building operation and monitoring of utility systems in real-world conditions.
— To determine the return on investment in energy reduction. The full value of these savings and costs should be taken into account when designing and implementing a cost reduction program.
Basic calculations generally showed that most buildings did achieve energy savings. About half of the buildings also showed some reduction in water consumption compared to the initial internal water consumption models. However, more detailed development of water consumption benchmarks will help to improve the accuracy of internal water consumption reduction calculations in the future.
The results of the study provide a solid basis for continuous monitoring of building utility systems and a baseline that building owners can use to evaluate future system optimizations or equipment upgrades.
The survey conducted as part of this small study did not reveal a clear correlation, positive or negative, between satisfaction with building temperature and building energy intensity or energy savings.
НРАСEngineering (October 2006).

Добавить комментарий